
An smart visibility checking tool helps you see how often your brand, products, and pages appear in generated results, answer engines, and other discovery experiences. When you compare options, the goal is not to find the flashiest dashboard. It is to choose a platform that gives dependable visibility signals, useful segmentation, and enough context to support real decisions. A good starting point is understanding how brand visibility is measured across search surfaces so every tool is judged against the same framework.

For most teams, the best fit balances coverage, reporting depth, workflow, and cost. That is why many evaluations begin with a practical question: which features matter first. In most cases, the answer comes down to the prompts and topics a tool tracks, the pages or entities it recognizes, and how clearly it shows movement over time. If you want a useful visibility checking tool for brands, focus on whether it helps your team act on findings instead of just collecting more data.
What a visibility checking tool should measure
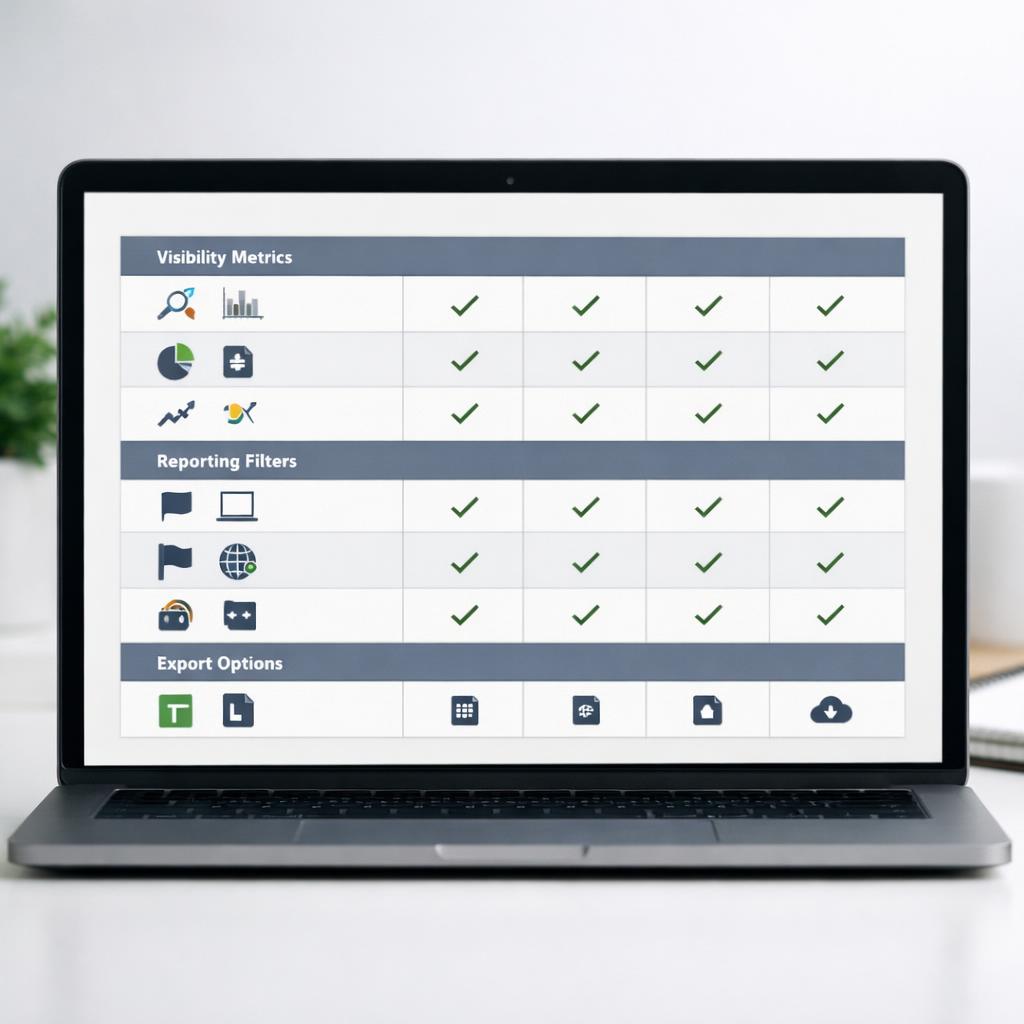
A strong visibility checking tool should measure more than simple appearance counts. It should show where your brand is mentioned, which pages are cited, how often competitors appear, and whether visibility changes by topic, device, location, or intent. That level of detail matters if you want to report on visibility in generated results with confidence. Broad coverage without context creates noise, while narrow tracking can hide important shifts.
It also helps when a platform separates branded and non-branded prompts, flags direct versus indirect mentions, and connects visibility to specific URLs. For publishers, in-house teams, and agencies, that makes it easier to see whether product pages, category pages, articles, or company information are earning exposure. Because interfaces and outputs can change quickly, no system should be treated as fixed. Neutral measurement, trend tracking, and flexible filters usually matter more than any claim of guaranteed placement.
- Prompt coverage: Tracks a representative set of topics and queries.
- Source attribution: Shows which pages or domains are surfaced.
- Segmentation: Filters by device, market, topic cluster, or intent.
- Trend reporting: Compares visibility over time instead of isolated snapshots.
Core metrics that make reports useful
The most helpful reports combine visibility rate, share of mentions, citation frequency, page inclusion, and competitive presence. Visibility rate shows how often your brand or page appears across the prompts being tracked. Share of mentions compares your presence with competing brands in the same prompt set. Citation frequency matters because a brand mention without a referenced page may deliver less value than repeated page-level inclusion.
Look for metrics that can be broken down by prompt group, content type, and time period. A good tool should also help you measure search exposure across answer engines without forcing you to export everything into a spreadsheet first. Clear labels, saved filters, and side-by-side comparisons save time. If reporting is hard to interpret, even a large data set becomes difficult to use for planning content, proving value, or spotting sudden visibility drops.
How to compare tools without wasting time or budget
Start with a shortlist based on reporting needs, not feature lists alone. Some teams need executive summaries and monthly trends. Others need page-level diagnostics, competitor gap views, and exports for analysts. When comparing platforms, test the same prompt set in each one. Then review how clearly they report changes, how often they refresh data, and whether their filters are actually useful. That makes it much easier to decide which features deserve priority.
Budget decisions should also reflect workflow fit. A lower-cost platform can create hidden labor costs if tagging, filtering, and reporting require too much manual cleanup. On the other hand, a higher-priced option is not automatically better if its coverage does not match your vertical, market, or reporting style. The best choice is usually the one that helps your team reach conclusions faster, communicate findings clearly, and keep monitoring consistent over time.
Questions to ask before committing
- What sources are monitored? Confirm the tool covers the discovery surfaces that matter to your audience.
- How is visibility defined? Ask whether it tracks mentions, citations, linked pages, or all three.
- Can you segment data? Useful tools allow filtering by topic, competitor, geography, and content type.
- How often is data refreshed? Reporting cadence affects how quickly you can respond to change.
- What can you export? Exports matter for stakeholder reporting and deeper analysis.
- Is onboarding practical? A slow setup process can delay value and limit adoption.
It is also smart to review sample reports before signing a contract. Ask whether dashboards are easy for non-specialists to understand, whether historical views are included, and whether you can save custom views for recurring reporting. If your team cannot quickly answer simple questions from the interface, the tool may add friction instead of clarity.
How to turn visibility data into better content decisions
Once measurement is in place, the next step is turning findings into action. Visibility data becomes valuable when it shows which topics trigger brand mentions, which pages are cited most often, and where competitors appear more consistently. That can shape new content creation, page updates, internal linking, and clearer page positioning. Teams that study patterns rather than isolated wins usually get better results because they can see where exposure is growing, flattening, or being lost.
A practical workflow often starts with monthly monitoring, then moves into analysis by topic cluster, page type, and competitor overlap. From there, prioritize updates to pages that are already close to earning broader inclusion, and document what changed so future reporting has context. If your team needs a repeatable process, it helps to connect monitoring with a content refresh plan such as how to update pages based on visibility insights. That keeps your smart visibility checking tool tied to editorial and optimization work instead of passive observation.
Keep the process simple. Review branded and priority non-branded prompt sets regularly, compare trend lines month over month, and revisit tracked prompts every quarter so weak or outdated queries do not clutter reports. After important page updates, recheck whether cited URLs, mentions, or competitor overlap changed. Over time, this creates a feedback loop between reporting and content work, which is where the strongest value usually comes from.

Conclusion
Choosing an smart visibility checking tool is less about chasing perfect coverage and more about finding dependable measurement that supports decisions. The right option should show where your brand appears, which pages are surfaced, how competitors compare, and what changes over time. It should also fit your reporting workflow so insights move from dashboards into content planning, stakeholder updates, and ongoing optimization.
If you are comparing platforms, keep the process simple: test the same prompt set, review the clarity of metrics, check filters and exports, and confirm that reporting reflects the search experiences you care about most. A strong visibility checking tool will not promise fixed outcomes, but it will help you understand exposure, identify gaps, and make smarter content decisions with more confidence.
FAQ
What metrics matter most in a visibility checking tool?
The most important metrics are visibility rate, share of mentions, citation frequency, page-level inclusion, and competitor presence. Together, these show not just whether your brand appears, but how often, in what context, and against which rivals. Filters by topic, intent, and time period make those metrics far more useful.
How often should you review visibility reports?
Most teams should review core reports monthly, with lighter weekly checks for priority topics or branded prompts. Monthly analysis is usually enough to spot meaningful trends without overreacting to short-term movement. If you publish often or operate in a fast-moving category, more frequent monitoring can help you respond faster while still keeping decisions grounded in patterns.


